How to see linkedin statistics | 2 attractive methods

Today, when many businesses and people with different goals are on social networks. Examining the criteria and qualifications of each social network in the form of communication with users can provide us with useful information. It's great to hear the rationale for this assessment from Hootsuite's director of customer relations, Gerard Recio:
without reviewing and calculating the results of our efforts on social networks, how can we understand whether our strategy has been successful on these networks or not? For this reason, we must use analysis tools to check our activities on social networks. This way, we can determine our main goals and then create short-term and long-term goals.
According to Gerard Sio, in this blog post, we will show you a method to check LinkedIn posts and articles through the analytics panel of this social network. First, we'll show you how to use LinkedIn's analytics dashboard, and then we'll discuss the metrics LinkedIn shows for each post on a user account and business account.
LinkedIn metrics are evidence of our marketing efforts. This data allows us to measure our success more accurately. It also gives him the insight he needs to prove and improve his ROI on social media. In this blog post, I tried to introduce you to the most important available metrics of LinkedIn measurement and analytics, as well as analytics dashboards for this social network.
Before reading the article, you can watch the following video and read the additional information in the rest of the article
How to see LinkedIn statistics
The LinkedIn analytics dashboard can give us a good idea of the content published, the golden moment of content publication, etc.;
For example, which publication most interested our subscribers, and which they did not like. These analytics help us to optimize the performance of our user account or business account on LinkedIn, resulting in the highest engagement with our subscribers.
User Account Analysis
in the user account, The amount of information LinkedIn provides us is very limited. Here we read a description of them.
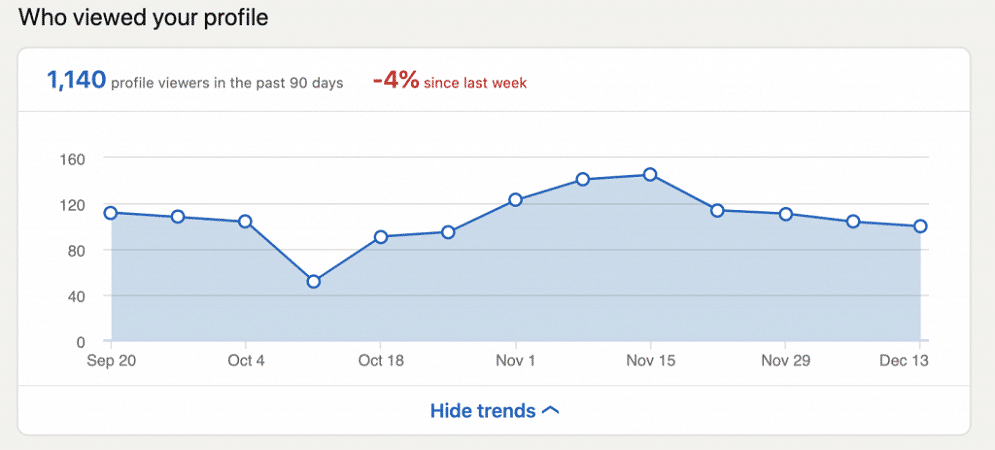
- Who Viewed Your Profile:
There are users who have seen our account.
- Post Viewer:
It indicates the number of views of our published articles.
- Search Appearances:
How many times our account was shown to LinkedIn users in search results in the last seven days?
- Views of Your Post:
The number of times LinkedIn users viewed our posts.
- Comments :
This is the number of comments that LinkedIn users leave on our posts.
- Likes :
This is the number of likes that LinkedIn users have placed on our posts.
- Reshares :
A number of reposts of our posts by LinkedIn users.[caption id="attachment_30595" align="alignright" width="995"]
 see LinkedIn statistics[/caption]
Visitor analysis (Visitors)
- Traffic :
This metric shows the number of unique visitors to each page and the number of page views over time. By clicking on the menu, we can choose other criteria and dates. The charts we see update data 24 hours after the end of the previous day and do not represent today's data or the previous day as a whole.
- All Page :
This metric shows the details of our website.
- All Career Page:
If you have a professional page This graph shows the number of times visitors clicked on different elements of your page. This criterion may be useful for people who work in the Human Resources department of a company. Because using this can identify people who are interested in the position.
- Page Views:
An image showing the number of visits to our business page.
- Unique Visitors :
Graph showing how many LinkedIn users visited our page. The difference between this metric and pageviews is that it doesn't take into account repeated visits by a user to the same page.
- Visitor Demographics :
This is what separates our company followers. This standard includes five types of demographic information. By clicking the menu and selecting the desired filter, we can view information related to work history, industry, job duties, geography, and the size of the individual's company.
- Total Life Page Traffic :
This metric shows the number of views and unique visitors to our bio page. With the help of the table, we can separate visits based on different pages; Like targeted visits. This table also contains information about all published and unpublished pages.
Analysis of updates
- Engagement Highlights:
It shows the total number of likes, comments, and shares, as well as new followers for different time periods.
- Likes:
Shows the number of likes at different times.
- Comments:
It shows the number of comments at different times.
- Shares:
It shows the number of shares in different periods.
- Follows:
It shows the number of followers in different time periods.
- Engagement :
Shows engagement metrics for organic and sponsored content over time. From this list, we can select other criteria and desired dates.
- Sponsored:
Shows our sponsored campaigns. To get more information on sponsored content, we should read this link.
- Update Engagement:
It shows organic and sponsored interaction metrics for each post separately.


Comments
Post a Comment